
Abstract
The Kemp’s ridley sea turtle (Lepidochelys kempii), the world’s smallest and critically endangered sea turtle species, has experienced significant declines in nesting populations. Most nesting occurs along the western Gulf of Mexico from Texas to Veracruz, Mexico, with historical concentrations in Rancho Nuevo. However, bycatch in the 1980s diminished the population, leading to conservation efforts aimed at establishing a secondary nesting colony on Padre Island National Seashore. These efforts involved relocating nests to safer locations for protection against predation and tidal inundation. Despite successful population recovery, concerns persist regarding complications to hatchling fitness and sex ratios. Here, we show that relocated nests in North Carolina yield higher hatching and emergence success rates compared to in situ nests, with relocated clutches exhibiting 27.5% higher hatching success and 12.3% higher emergence success. These differences are likely due to the additional protection from environmental stressors provided by relocation. Most nests, both relocated and in situ, exhibited incubation periods of less than 55 days, associated with higher hatching success, exceeding 75.9%. June, the most common nesting month, with an average incubation period of 57 days, yields a balanced 1:1 sex ratio. This study adds insight into the effectiveness of nest relocation, demonstrating its potential benefits for hatching and emergence success. However, further research is needed to assess its impact on hatchling fitness and sex ratios, particularly through TSD studies. It is recommended to prioritize in situ nest conservation with additional protective measures at natural nesting sites to mitigate risks while maintaining hatchling health.
Introduction
Sea turtle populations around the world have experienced significant declines due to a combination of environmental and anthropogenic factors, including pollution, overfishing, bycatch, and coastal destruction (Vázquez-Sauceda et al., 2008). A major threat to these species is incidental capture by shrimp trawlers in the Gulf of Mexico, which causes turtles to drown (Marquez et al., 1996). Among the most endangered sea turtle species is the Kemp’s ridley (Lepidochelys kempii), which holds the distinction of being the world’s smallest and critically endangered sea turtle (Shaver et al., 2020 and NOAA, 2025). The majority of Kemp’s ridley nesting occurs along the western shoreline of the Gulf of Mexico, stretching from Texas to Veracruz, Mexico (Shaver et al., 2020). The most crucial nesting site for this species is located near the village of Rancho Nuevo, in Tamaulipas, Mexico (Vázquez-Sauceda et al., 2008; Shaver et al., 2020). Up until the 1960s, the Kemp’s ridley was abundant in the Gulf of Mexico. During this period, the species also exhibited a synchronous nesting emergence event known as an arribada, which occurred annually (Vázquez-Sauceda et al., 2008; Shaver et al., 2020). During this unique nesting event, which takes place from April to July, large groups of females gather offshore and come ashore simultaneously to nest (Vázquez-Sauceda et al., 2008; National Marine Fisheries Service, U.S. Fish and Wildlife Service, and SEMARNAT, 2011; Shaver et al., 2020). These synchronized arribadas are correlated with high north wind speeds and changes in barometric pressure. Following this event, large groups of hatchlings emerge around the same time, typically at night or in the early morning, after an incubation period of 45 to 58 days, depending on temperature (National Marine Fisheries Service, U.S. Fish and Wildlife Service, and SEMARNAT, 2011). This synchronous emergence is thought to increase hatchling survival and success by reducing predation risk, as the abundance of hatchlings makes it difficult for predators to consume all of them. (Females typically nest every 1 to 3 years, laying an average of 2 to 3 clutches per season. When laying eggs, females dig an egg chamber about a meter deep and lay up to 100 eggs in a single clutch. The eggs then incubate for 45 to 60 days (National Marine Fisheries Service, U.S. Fish and Wildlife Service, and SEMARNAT, 2011). Upon emerging, hatchlings rely on visual cues to reach the ocean, orienting themselves toward the brightest horizon (NOAA, 2025). On natural beaches, this typically lies over the open ocean and guides hatchlings safely to the water. However, on developed beaches, artificial lighting from buildings, roads, and other infrastructure behind dunes can disorient them and lead them inland, increasing mortality. Protecting nests on undeveloped beaches may provide the best source of survival and recovery for the species.
Due to intense fishing effort during the 1980s, the Kemp’s ridley nesting population had reached a record low of only 702 nests, likely due to bycatch complications (National Marine Fisheries Service, U.S. Fish and Wildlife Service, and SEMARNAT 2011; Shaver et al., 2020). To protect the Kemp’s ridley from extinction, a secondary nesting colony was established at Padre Island National Seashore in North Padre Island, Texas, which offers the longest stretch of undeveloped barrier island beach in the United States. Today, Padre Island National Seashore remains the primary location for Kemp’s ridley nesting. Since 2010, annual nest numbers have deviated from the predicted exponential increases based on historical trends, resulting in a decline in nesting activity. In response to this decline, conservation efforts have focused on protecting nests by relocating clutches from their original, threatened sites to more secure, controlled locations, such as hatcheries or elevated regions of the beach. These relocated nests are secured with corrals, cages, and metal or mesh coverings (Shaver et al., 2020). This strategy safeguards developing eggs from threats such as predation, tidal fluctuations, storms, elevated temperatures, marine debris, and anthropogenic activities such as poaching and vehicle disturbance (Shaver et al., 2020).
Although these protective measures have contributed to the recovery of the species’ population, some critics have raised concerns about the relocation and protected incubation of clutches as conservation strategies (Shaver et al., 2020). Nest relocation is controversial because altering the location of clutches can impact hatchling fitness and sex ratios (Godfrey and Mrosovsky, 1999). The sex of sea turtles is determined by the incubation temperature of the eggs (Geis et al., 2005). Under natural conditions, following a temperature-dependent sex determination (TSD) regime, sex is typically balanced in a 1:1 ratio, with the production of females and males in equal numbers (Godfrey and Mrosovsky, 1999; Geis, 2005). Cooler temperatures produce males, while warmer temperatures produce females (Wibbels, 2003). Disrupting this natural process can influence the reproductive ecology and long-term recovery of the population (Geis et al., 2005). Moreover, modifying the natural incubation environment may affect hatchling morphology, including scute pattern, locomotive performance, fitness, and overall viability (Mueller et al., 2019; Steenacker, 2023).
In recent years, small numbers of Kemp’s ridleys have been observed nesting along the shorelines of North Carolina, outside their historical nesting range. This behavior has become increasingly common as water temperatures continue to rise in northern coastal areas during the spring (National Marine Fisheries Service, U.S. Fish and Wildlife Service, and SEMARNAT, 2011). Management strategies for the species in North Carolina have involved both the relocation of clutches to safer incubation locations and modifications to in situ nests. This study aims to evaluate the effects of relocated versus in situ management measures on Kemp’s ridley clutches, focusing on factors such as hatching and emergence success. Understanding these effects will provide valuable insights for researchers and conservation programs in North Carolina, helping to determine the most effective approaches for the recovery of the species. I hypothesize that relocated clutches will exhibit higher hatching and emergence success compared to in situ clutches.
Materials and Methods
Nesting location
The data for this study, provided in an Excel spreadsheet containing detailed information on Kemp’s ridley nesting data from 2003 to 2024, was imported into ArcGIS Pro for analysis (Table 1). The file was linked to a new project within the software and data was imported as a table. To convert the tabular data into spatial points, the “XY Table to Point” tool was utilized. This tool converted the provided latitude and longitude coordinates of each nesting location into corresponding geographic points on the map. Each point represented a unique identification (UID) containing all relevant information associated with the specific nesting location, including nesting activity date, emergence date, incubation period, management efforts, the proportion of live versus dead hatchlings, and other factors influencing the nest.
Using this data, the total number of nests laid on each beach was calculated, and the percentage of nests for each location was determined by dividing the number of nests at a given beach by the total number of nests recorded across all years (2003-2024), which amounted to 82 nests in total. This methodology allowed for the spatial visualization of nesting site distribution, ensuring that each location was accurately represented for subsequent analysis.
***For visual reasons we had to remove the table intended here. Please refer to “Download this article” at the bottom of this page to view the full article including the table with all of Table 1. Kemp’s ridley nesting data in North Carolina from 2003-2004***
Table 1. Kemp’s ridley nesting data in North Carolina from 2003-2024.
Hatching & emergence success in relocated vs. in situ nests
Prior to making any calculations, each unique identification (UID) corresponding to individual nesting activity was color-coded to differentiate between relocated nests (grey) and in situ nests (Table 1). A total of 18 nests were relocated, while 49 nests remained in situ. The hatching success for both relocated and in situ nests was then calculated separately. The total hatching success for relocated nests was 1241.82, while the total for in situ was 2651.54. The average hatching success for each group was computed by dividing the total hatching success by the number of nests in each category (1241.82/18 for relocated and 2651.54 /49 for in situ). The same procedure was applied to calculate emergence success. The total emergence success for relocated nests was 1012.23 and 2454.20 for in situ nests. The average emergence success for each group was then calculated by dividing the total emergence success by the respective number of nests in each group (1012.23/18 for relocated and 2454.20/49 for in situ).
Relocated and in situ management effects on incubation
Using the data provided on hatchling characteristics in Table 1, including unhatched eggs, dead hatchlings, live hatchlings, washovers, and predation, analysis was made to assess the impact of these factors on incubation and hatching and emergence success. The total number of individuals or events in each category was totaled and averaged for both relocated and in situ groups. Additionally, the percentage of individuals affected in each group was determined using the formula: (condition group/total condition in both groups) * 100.
Incubation trends across the years 2003 to 2024
Before calculating the incubation period for each unique identification (UID), nests with both recorded nesting activity and emergence dates were selected, as these provided accurate incubation period data. The months of May, June, and July were considered in the analysis of nesting activity. To calculate the total incubation days and their averages for each month, the total number of days recorded across all nests in that month was summed and divided by the number of nests laid in that month. Only months with recorded incubation periods were included in these calculations. For May, a total of 509 incubation days were recorded, which, when divided by 8 nests, resulted in an average incubation period of 63.6 days. In June, a total of 1715 incubation days were recorded, which, when divided by 30 nests, yielded an average incubation period of 57.2 days. For July, a total of 496 incubation days were recorded, and dividing by 9 nests resulted in an average incubation period of 55.1 days. These averages represent an average incubation period duration for nests laid in each of the three months.
Next, nesting activity and emergence months were analyzed by year to identify trends across the years 2003 to 2024. This analysis included all 67 nests laid during May, June, and July regardless of whether emergence dates and incubation periods were recorded. The months considered for nesting activity were May, June, and July. The total number of nests laid in each month was visually presented as a figure to highlight trends in nesting activity months across the years 2003 to 2024. Similarly, the same procedure was applied to emergence data, which included the months of June, July, August, and September. The total number of nests emerging in each of these months was also visually depicted in a figure to show trends in emergence months across the years 2003 to 2024.
Average incubation period and hatching success in relocated versus in situ nests
The 47 unique identification nests (UID) with recorded incubation periods were grouped into three categories based on the length of the incubation period: greater than 60 days (X > 60), between 55 and 60 days (60 > X > 55), and less than 55 days (X < 55). These nests were further classified into two groups, relocated and in situ, and color-coded based on previous analyses. The distribution of nests across the categories was as follows: 15 nests in the X > 60 category, 17 in 60 > X > 55, and 15 in X < 55. For each category, the total incubation days and hatching success for relocated and in situ nests were summed, and the averages were calculated by dividing the totals by the number of nests in each group. In the X > 60 category, relocated nests had a total of 270 incubation days, which, when divided by 4 nests, resulted in an average of 67.5 days. The total hatching success for relocated nests in this category was 187.34, yielding an average success rate of 46.8. For in situ nests in the same category, a total of 731 incubation days was recorded, resulting in an average of 66.5 days when divided by 11 nests. The total hatching success was 645.36, which, when divided by 11, provided an average success rate of 58.7. In the 60 > X > 55 category, relocated nests had a total of 280 incubation days, yielding an average of 56 days when divided by 5 nests. The total hatching success was 368.1, with an average success rate of 73.6. For in situ nests, a total of 678 incubation days were recorded and divided by 12, resulting in an average of 56.5 days. The total hatching success was 801.07, yielding an average success rate of 66.8.
In the X < 55 category, relocated nests had a total of 407 incubation days, which, when divided by 8 nests equals an average incubation period of 50.9 days. The total hatching success was 606.8, yielding an average success rate of 75.9. For in situ nests in the same category, there were a total of 354 incubation days recorded and divided by 7, resulting in an average of 50.6 days. The hatching success totaled 584.4, yielding an average success rate of 83.5.
Results
Nesting location Nesting locations varied across the 67 nests recorded between 2003 and 2024. The most frequently visited nesting site was Cape Hatteras National Seashore with 25 nests, representing 30.5% of the total (Figure 1). The second most popular location was Cape Lookout National Seashore with 15 nests (18.3%), followed by NEST (Northern Outer Banks) with 10 nests (12.2%). Caswell Beach, Emerald Isle, Hammocks Beach State Park, and Pine Knoll Shores each hosted 4 nests (5%). Indian Beach/ Salter Path accounted for 3 nests (4%). Fort Fisher State Recreation Area, Lea-Hutaff Island, and Topsail Island each had 2 nests (2%). Atlantic Beach, Bald Head Island, Figure 8 Island, Holden Beach, Ocean Isle Beach, and Onslow Beach each had 1 nest (1%).
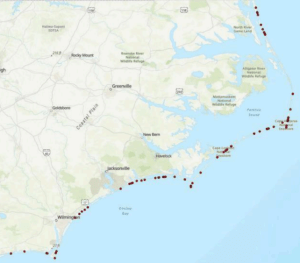
Figure 1. Map of Kemp’s ridley nesting locations in North Carolina from 2003-2024 generated from an ArcGIS project.
Hatching & emergence success in relocated vs. in situ nests On average, both hatching and emergence success rates were higher in relocated nests compared to in situ nests (Figure 2). The average hatching success for relocated nests was 68.99, while in situ nests had an average hatching success of 54.11. This indicates a 15% higher success rate in relocated nests. Similarly, the average emergence success for relocated nests was 56.24, compared to 50.09 for in situ nests, reflecting a 6% higher emergence success rate in relocated nests.
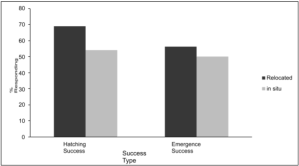
Figure 2. Average hatching & emergence success of relocated and in situ Kemp’s ridley sea turtle nests in North Carolina.
Relocated and in situ management effects on incubation In summary, in situ nests were exposed to significantly more threats and stressors compared to relocated nests (Figure 3). On average, relocated nests contained 24.2 unhatched eggs, while in situ nests had 47.1. Approximately 66% of the unhatched eggs were from in situ nests. The average amount of dead hatchlings was also higher in in situ nests, with 1.5 in relocated nests and 2.0 in in situ nests, accounting for 57% of the total dead hatchlings. Additionally, relocated nests produced an average of 14.4 live hatchlings, compared to 2.8 in in situ nests, meaning 84% of the live hatchlings were from relocated nests. Washover events occurred more frequently in in situ nests, with an average of 0.2 events in relocated nests and 1.7 in in situ nests. 89% of washover events occurred in in situ nests. There were 3.1 predated eggs in relocated nests and 9.7 in in situ nests, reflecting 76% of predated eggs from in situ nests.
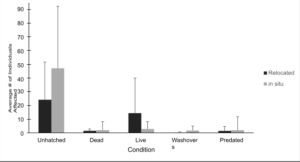
Figure 3. Average condition of individual Kemp’s ridley hatchlings during incubation and post- hatching.
Incubation trends for each nest Among the 47 nests with recorded incubation data, June was the most active nesting activity month, with a total of 30 nests laid (Figure 4). The average incubation period for nests laid in June was 57 days. July represented a moderately active nesting activity month, with 9 nests laid and an average incubation period of 55 days. May was the least active nesting activity month with 8 nests laid and an average incubation period of 63 days.
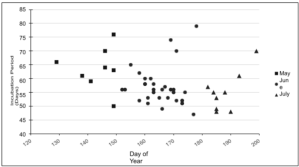
Figure 4. Kemp’s ridley nesting activity month and total incubation period duration (days).
Incubation trends across the years 2003 to 2024 In total, 11 nests were laid in May, 53 in June, and 15 in July (Figure 5). Between 2003 and 2024, June consistently recorded the highest level of nesting activity, accounting for 67% of all recorded nests laid during this period. June was particularly notable in the years 2018, 2020, 2021, 2022, and 2024, with 5-9 nests laid each year. July ranked as the second most active nesting activity month, contributing to 19% of all recorded nests laid during this period. Nesting activity in July was also elevated in the years 2018, 2020, and 2024 with 3-4 nests laid each year. May was the least active nesting activity month accounting for 14% of all recorded nests laid during this period. The year 2021 stood out as an especially active nesting period for May with a total of 4 nests recorded.
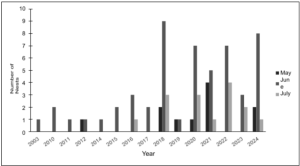
Figure 5. Kemp’s ridley total monthly nesting activity through the years 2003-2024.
For emergence dates, 6 nests emerged in June, 3 in July, 37 in August, and 3 in September (Figure 6). Between 2003 and 2024, August was the most prominent emergence month, accounting for 76% of all recorded nests emerging during this period. June followed as the second most common emergence month, contributing 12% of the total, with 1 nest emerging in 2015, 1 in 2017, and 4 in 2018. Only 6% of nests emerged in July, with 2 recorded in 2021 and 1 in 2024. Again, only a small portion of nests (6%) emerged in September, with occurrences in 2022 (2 nests) and 2024 (1 nest).
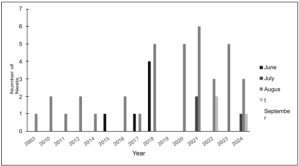
Figure 6. Kemp’s ridley total monthly emergence activity through the years 2003-2024.
Average incubation period and hatching success in relocated versus in situ nests Nests with the longest incubation periods, greater than 60 days, exhibited the lowest hatching success rates (Figure 7). These nests had an average incubation period of 67.5 days (relocated) and 66.5 days (in situ), with relocated nests showing an average hatching success rate of 46.8, while in situ had an average hatching success rate of 58.7. Nests with incubation periods between 55 and 60 days, with average incubation periods of 56 days (relocated) and 56.5 days (in situ), demonstrated intermediate hatching success rates. The average hatching success rate for relocated nests in this group was 73.6, while in situ nests had an average hatching success rate of 66.8. Nests with the shortest incubation periods, less than 55 days, displayed the highest hatching success rates. These nests had average incubation periods of 50.9 days (relocated) and 50.6 days (in situ), with relocated nests achieving an average hatching success rate of 75.9, and in situ nests showing an average hatching success rate of 83.5.
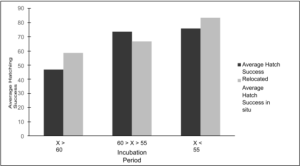
Figure 7. Kemp’s ridley average incubation period (days) split amongst three categories (X > 60, 60 > X > 55, and X > 55) compared to average hatching success in relocated and in situ nests.
Discussion
My hypothesis was accepted as relocated clutches exhibited higher hatching and emergence success compared to in situ clutches. On average, relocated clutches demonstrated a 27.5% higher hatching success and 12.3% higher emergence success than their situ counterparts. These differences are likely attributable to the enhanced protection afforded to relocated clutches, shielding them from threats and environmental stressors such as predation and tidal inundation, facilitating more successful egg incubation. These findings are consistent with those of the bi-national, multi-agency effort on Padre Island National Seashore, which reported a 12.5-32.5% higher success rate for translocated clutches compared to in situ clutches laid at Rancho Nuevo. Additionally, these translocated hatchlings exhibited a 13% higher survival rate during beach release (Shaver et al., 2020). Although this dataset did not measure hatchling survival during beach release, it did provide insight into the proportion of live versus dead hatchlings in both relocated and in situ nests. Among the 82 nests identified, relocated nests contained 84% of the total live hatchlings, while in situ nests contained 57% of dead hatchlings. The primary causes of increased mortality in in situ nests included unhatched/undeveloped eggs, predation, or natural disturbances such as washovers.
A significant proportion of unhatched eggs, 66%, were found in in situ nests. Predation is a common threat to nests, with species such as coyotes, dogs, cats, and ghost crabs frequently targeting hatchlings. Relocated nests experienced 68% fewer predation events, suggesting the efficacy of protective measures. These measures, including metal and plastic cages and screens, were effective in mitigating the risk of predation. Natural disturbances, particularly washover
events, also played a crucial role in influencing hatching and emergence success. From 2003 to 2024, relocated nests encountered only 3 washover events, affecting 2 nests, whereas in situ nests experienced 75 washover events, impacting 19 nests. These disturbances frequently inhibited egg development or resulted in complete nest loss. For example, nest 277357 from 2020 was subject to 8 washover events, trapping hatchlings beneath the sand, and requiring human intervention for their release. This nest exhibited a notably low hatching success of 17% and a 0% emergence success. Overall, relocating nests minimizes exposure to threats such as predation, human disturbance, and washovers, thereby increasing hatching & emergence success rates.
Despite the overall trends observed, there are notable discrepancies in the data, particularly regarding the incubation period duration and its potential effects on hatchling fitness and sex ratio. Previous research on green sea turtles has suggested that shorter incubation periods are associated with lower hatching success, while longer incubation periods generally lead to higher hatching success (Steenacker et al., 2023). However, the results of this study do not support these findings. Shorter incubation periods (less than 55 days) were associated with the highest hatching success, exceeding 75.9% in both relocated and in situ nests. In contrast, the longest incubation periods (greater than 60 days) were linked to the lowest hatching success, ranging from 46.8% to 58.7%. The majority of nests (68%), had incubation periods longer than 55 days, and these nests generally exhibited lower hatching success.
Additionally, in situ nests exhibited longer incubation periods, with an average of 58.8 days, compared to relocated nests, which averaged 56.3 days. More in situ nests had hatching success rates above 70% (19 in situ nests compared to 10 relocated nests). However, relocated nests showed a higher proportion of intermediate hatching success (greater than 50%), but lower success rates (below 50%) compared to in situ nests. These findings challenge the conclusions of Steenacker et al., (2020), suggesting that the relationship between incubation period and hatching success may be more complex for Kemp’s ridley turtles than for green turtles. Additional analysis with a larger dataset of nesting and incubation periods could provide added insight into this relationship. The effects of incubation period duration on sex ratio remain unclear in this dataset, as temperature measurements are not available. However, it is evident that June is the most common month for nesting activity, with an average incubation period of 57 days. This duration represents a middle ground between the extremes observed in May and July. July, the second most active nesting month, had an average incubation period of 55 days, the shortest of all months. In contrast, May, the least active nesting month, had an average incubation period of 63 days, the longest of all months. Without temperature data, it is challenging to determine how these varying incubation periods affected the sex ratios of hatchlings. However, it is apparent that June, with its 57-day incubation period, is the most favorable month for nesting, yielding the highest number of nests. This suggests that June’s temperatures may be optimal and stable, potentially resulting in a balanced, 1:1 sex ratio of hatchlings. In comparison, May, being the earliest and coolest nesting month, experiences fluctuating temperatures over a longer incubation period, which could skew the sex ratio toward males. July, the warmest month, may influence the sex ratio by producing a higher proportion of female hatchlings due to more extreme temperatures.
Another interesting discrepancy in the data pertains to the location of the nests. The historic nesting range of the species is primarily along the western Gulf of Mexico, spanning from Texas to Mexico, with a concentration in Tamaulipas, Mexico. Padre Island National Seashore represents the largest nesting site in the U.S. However, less frequent nesting has also been observed in other parts of Texas, as well as in several states along the southeastern U.S., including Florida, Alabama, Georgia, South Carolina, and North Carolina (National Marine Fisheries Service, U.S. Fish and Wildlife Service, and SEMARNAT, 2011).
From 2003 to 2024, Cape Hatteras National Seashore emerged as the most frequently used nesting beach for Kemp’s ridley sea turtles, hosting 30.5% of all recorded nests. Cape Lookout National Seashore followed with 18.3% of all recorded nests, and NEST (Northern Outer Banks) accounted for 12.2% of the total. The first recorded Kemp’s ridley nesting on Cape Lookout National Seashore occurred in 2003, though there was a data gap between 2003 and 2010. Since 2010, at least one nesting event has been documented annually. This trend aligns with reports from the bi-national recovery program, which indicated that the Deepwater Horizon oil spill in 2010 likely disrupted nesting activities (National Marine Fisheries Service, U.S. Fish and Wildlife Service, and SEMARNAT, 2011). However, the species has since established regular nesting in North Carolina, with nest numbers steadily increasing to as many as 14 per year
between 2018 and 2024.
From 2003 to 2024, June was consistently the most active nesting month, while August was the most common emergence month. From 2003 to 2017, only 1 to 4 nests were laid per year along North Carolina’s coastline. However, 2018 marked a sudden increase in nesting activity with 14 nests recorded across May, June, and July. From 2018 to 2024, at least 11 nests were laid each year, excluding 2019. This increase suggests either a rise in the number of Kemp’s ridleys nesting in North Carolina or that data from earlier years was limited. One possible explanation for this sudden rise in nesting activity could be attributed to the implications of the species’ migratory life cycle, coupled with warming ocean temperatures, which may be influencing changes in breeding and nesting patterns.
The Kemp’s ridley sea turtle has a complex life cycle consisting of three distinct stages: hatchling, juvenile, and adult, each associated with distinct ecological zones: terrestrial, neritic, and oceanic. Nesting females and hatchlings primarily occupy the terrestrial zone, characterized by beaches. Upon emergence from nests, hatchlings transition to the neritic zone by actively swimming offshore following boundary currents. While this phase remains poorly understood, it is believed to resemble the loggerhead model (National Marine Fisheries Service, U.S. Fish and Wildlife Service, and SEMARNAT, 2011). Once post-transitional hatchlings mature into juveniles, they enter the oceanic zone, where they become passive drifters in oceanic currents. During this stage, it is hypothesized that juveniles migrate to the Sargassum community where they forage on Sargassum and small invertebrates. This oceanic juvenile stage can be divided into two distinct groups: one remaining within the northern and western Gulf of Mexico (which includes the majority of Kemp’s ridleys) and another was transported to the Gulf Stream of the Northwest Atlantic. The duration of this stage can vary, lasting from one to four years, or potentially longer (National Marine Fisheries Service, U.S. Fish and Wildlife Service, and SEMARNAT, 2011).
As juveniles mature, they migrate from the pelagic, oceanic zone to the neritic zone, which encompasses nearshore areas within the Gulf of Mexico and the Northwest Atlantic. In this zone, they feed on decapod crustaceans and continue to grow into adults. This zone generally has temperate waters that fluctuate seasonally, with depths typically less than 50m in depth (National Marine Fisheries Service, U.S. Fish and Wildlife Service, and SEMARNAT, 2011). Adults are primarily found in the Gulf of Mexico but can also be located along the U.S. Atlantic Coast in nearshore waters less than 37m in depth. While breeding areas are not clearly defined, it is believed that mating occurs near the nesting beaches, typically around 30 days before the first clutch of eggs for the season is laid. After nesting, adult females migrate to foraging areas, traveling either northward to the Gulf of Mexico, particularly off the coasts of Texas and Louisiana, or southward to the Bay of Campeche. The waters off Padre Island National Seashore serve as an important migratory route for females, as most turtles that nest in Mexico travel northward following nesting (National Marine Fisheries Service, U.S. Fish and Wildlife Service, and SEMARNAT, 2011). Warming ocean temperatures may influence the migration patterns of Kemp’s ridley sea turtles, potentially driving them toward more temperate northern waters, where they remain into adulthood and breed. If females breed in these northern areas, they are likely to remain there until they are ready to lay their eggs. In the future, the hatchlings that survive in these regions may continue to nest in northern locations, such as North Carolina, further shifting the nesting range northward. This shift could have both positive and negative implications. A review by Simantiris (2024) suggests that climate change may benefit sea turtle populations, as warmer waters could facilitate the expansion of populations into higher latitudes with more favorable nesting beaches. While Padre Island National Seashore and Rancho Nuevo remain key nesting sites for Kemp’s ridleys, increased human activity and the growing unpredictability of coastal conditions, caused by changing weather patterns and storm trajectories, pose significant risks.
Identifying alternative nesting sites could prove valuable in the future. However, this shift may also lead to negative outcomes, such as altered hatchling sex ratios, spatial alterations in foraging grounds, impacts on fisheries and bycatch, and reduced reproductive output (Simantiris, 2024). Given the potential effects of warming sand temperatures on sex ratios, the increasing frequency of extreme weather events, the loss of coastal habitat due to anthropogenic activities, and heightened predation, it is essential to implement protective strategies during incubation. However, relocation may not always be the best solution, depending on the nest’s location and its potential impact on hatchling sex ratios. Rather than translocating clutches to potentially cooler, sheltered locations further up the beach, protective measures can be applied directly at the natural nesting site to safeguard the eggs. These measures may include mesh, plastic or metal coverings, fenced corrals, and sand barriers, which would protect the eggs from predation and storm surges while preserving the natural habitat. This approach helps minimize alterations to hatchling fitness and sex ratios. As previous studies have emphasized, it is vital for hatchlings to emerge independently and orient themselves toward the ocean, as this behavior strengthens their mobility and survival chances. Relocating hatchlings away from their natural nesting site can disrupt their survival instincts, swimming abilities, and the imprinting process necessary for females to return to the same location to lay their eggs.
Further research with larger, more comprehensive datasets is necessary to draw definitive conclusions regarding the Kemp’s ridley population. The current dataset is not sufficient enough to support broad generalizations regarding the species’ nesting and breeding patterns, particularly in relation to climate change. In North Carolina, a more extensive dataset is also necessary for informing and enhancing ongoing conservation efforts. Given that Kemp’s ridley nests are frequently misidentified as loggerhead nests, the true number of Kemp’s ridley nests may be underestimated. To address this, it is strongly recommended to implement more frequent DNA testing of eggs and nesting females. This approach would help identify nesting trends, assess population relatedness, and enable continuous monitoring of hatchling success. Such data would provide insight into whether nesting females and their hatchlings are genetically related, and whether hatchlings successfully reach adulthood and return to the same nesting beach.
Another important data gap is research on TSD, including the measurement of sand temperatures around nests throughout the incubation period. This information is critical for understanding how sand temperature influences hatchling sex ratios in relocated and in situ nests. With this data, more accurate conclusions could be drawn regarding sex ratio dynamics. Unfortunately, due to the unavailability of sand temperature, analysis was limited to examining the incubation periods of nests from 2003 to 2024.
Additionally, a key factor in assessing the success of relocated versus in situ nests, the effects of each practice on the fitness of hatchlings post-emergence, could not be analyzed. While there was data on the number of unhatched/undeveloped eggs, the proportion of live versus dead hatchlings, predation, and washovers, there was limited information on hatchling appearance, mobility, or overall fitness post-emergence. Although some hatchlings exhibited deformities, the available data was insufficient and lacked consistency, preventing any significant conclusions regarding hatchling health or fitness.
In conclusion, the decision to relocate Kemp’s ridley sea turtle nests is complex and should be approached with caution. While relocation can lead to higher hatching and emergence success rates, the long-term effects on hatchling survival, fitness, and sex ratios remain uncertain. For the management of Kemp’s ridley populations in North Carolina, it is recommended to implement protective measures at the natural nesting sites, such as mesh, plastic, and metal coverings, corrals, and sand barriers. These measures can protect the eggs in their original location, minimizing potential disruptions to hatchling development while preserving the natural habitat. This approach is essential for maintaining healthy sex ratios and fostering strong survival instincts. While relocation may offer short-term benefits, it could have unintended consequences for the species’ long-term health, such as reduced hatchling fitness and survival in adulthood. However, without comprehensive data on factors such as sand temperature, hatchling mobility, tagging, or DNA samples to track their development and migratory movements, it is difficult to definitively determine whether relocation or in situ protection yields better outcomes. Therefore, a more cautious approach, prioritizing in situ protection, is recommended to balance the immediate needs of the species with its long-term conservation.