
Students are often torn between their academic obligations and time taken to relax and socialize. There is a saying among undergraduate students regarding the “S” Triangle. It is the belief that college students cannot balance the following three options: sleep, studies, and a social life; they can only pick two. While this can be daunting to consider, there is a concept of a “third place,” which exists to serve all three components, regeneration, academics, and social interactions. When trying to picture a third place, think of a library or a coffee shop. People will go into these places with a varied set of purposes but will still leave with fulfillment. In a university setting, third places are easily accessible due to the walkable structure of most university campuses. It is considered a “third” place, since one’s first place is their home (where they spend most of their time) and their second place is their workplace (where they are required to go). In a university setting, and for the sake of this research, a second place can be defined as one’s workplace or their academic classes at their university. A third place creates an additional opportunity to be a part of a community and to foster socialization (Mclane & Kozinets, 2019). The goal of a third place is to have a space in which one can interact with others, something not possible for someone to do at home, at work, or in class.
Third places play a key role in how community is fostered. Community and sense of belongingness for this research were measured in three different ways. The General Belongingness Scale measured how much individuals feel like they belong to the university (Malone et al., 2011). The Inclusion of Other in Self scale measured how much individuals made the community part of their self-concept (Aron et al., 1991). The Sense of Community Index measured how individuals viewed the community itself (Cope et al., 2020).
The term “third place” was created by Ray Oldenburg, and it must have a certain set of defining characteristics to be considered a third place. The third place must be neutral ground, so that individuals don’t feel obligated to attend, it must be a leveler, so an individual’s status does not give them more value, it must prioritize conversation because socialization is the strongest component, it must be accessible so anyone can reach it; it must have regulars who can attract newcomers and give the place a comforting feeling, it must have a low profile so as to not hold any pretention, the mood should be playful so that individuals feel encouraged to display their personality, and it should act as a home away from home, so that individuals can leave feeling regenerated as they would if they were at home (Oldenburg, 1999).
In the context of a university, many places can fit this description. These places, like a Student Union, are meant to provide students with an experience that they cannot receive online. It should be fulfilling for students and a place to reduce stress, wherever that stress may have generated. If a place is considered “multi-use,” like many spaces on a university campus, it can create place attachment, which will encourage more frequent visits (Mclane & Kozinets, 2019).
Similar to the impact of third places, we also wanted to research students’ feelings of belonging and inclusion to the university. Elmhurst University has a varied student population, with 70% being commuter students and 40% being transfer students (Majka, 2019). These students are historically less attached to the university due to a lower amount of time spent there. Furthermore, Elmhurst University is growing in diversity, as it recently became a Hispanic Serving Institution, which means it has at least 25% Hispanic enrollment. The university recently passed a motion to accept and support diversity called “Together We Belong” (2024). This motion was shared publicly and throughout the institution. The goal of this motion was to continue promoting and protecting diversity. However, Hispanic/Latino students as well as LGBTQ-identifying students represent two marginalized groups on campus that may feel a different sense of belonging to the university. Our research aims to understand which third places students value, as well as the relationship between student demographic characteristics and belongingness at Elmhurst University.
The first hypothesis is that transfer and commuter students will score lower on the belongingness measures than four-year and residential students. The second hypothesis is that Hispanic/Latino students and LGBTQ-identifying students will score lower on the belongingness measures as well. We also conducted an exploratory analysis of the third places participants frequented and where they ranked on an accessibility scale and a characteristics scale.
Method
Participants
The sample included 120 undergraduate students from Elmhurst University. When comparing the sample size to the actual population at the university, the sample was relatively proportional. Of the 120 participants, 75 were commuters (64.7%) and 41 were residents (35.3%). According to a demographics study done by Dr. Liz Majka, 63.6% of Elmhurst University’s students were commuters, and 36.4% were residents (2019). In our study, 94 participants were traditional four-year students (81.0%) and 22 participants were transfer students (19.0%). The population at Elmhurst estimates that 63.9% of students are traditional four-year students, and 30.7% are transfer students. Our study had 36 participants who identified as Hispanic/Latino (31.0%). The University estimates that about 25.1% of their students are Hispanic/Latino, but that percentage has continued to grow since 2019. Finally, our study also had 26 participants who identified as LGBTQ+ (21.6%). There was no data available on the amount of LGBTQ students enrolled at Elmhurst University, potentially because students are not required to disclose that information.
Flyers of the survey (see Figure 1) were posted in every single building on campus, wherever there were designated boards. PDFs of the communication were sent out to the presidents of each active organization on campus.
Procedure and Design
Data was collected from 03/12/2025 – 04/25/2025. Participants were able to scan a QR code that was displayed on the flyer, and it would take them to a Qualtrics survey. The survey began with the Informed Consent, followed by a question regarding their eligibility. If a participant was not an Elmhurst University undergraduate student, their responses were later removed from the dataset. They were then taken through a series of demographic questions, regarding their race, ethnicity, age, gender, sexual orientation, transfer status, time at the university, undergraduate class standing, major, housing, method of transportation (if a commuter), length of commute, enrollment status (e.g. full-time / part-time), employment status, employment location, and employment hours. Following the demographics, participants were asked to fill out the belongingness measures.
The first measure was the General Belongingness Scale (GBS), which was meant to measure the social interaction and acceptance within a certain community (Malone et al. 2011). The GBS was a 12-item scale, where each prompt was modified to mention Elmhurst University (see Figure 2).
The next scale was a modified version of the Sense of Community Index (SCI), which was meant to measure how individuals view the community itself (Cope et al., 2020). There were variations of the 12-item scale that had the following subscales: “Meeting Needs,” “Shared Emotional Connection,” “Rational Connection,” “Membership,” and “Influence.” We decided to change “Meeting Needs” to “Goals Fulfillment” (3-item subscale), since we wanted to discover if students thought the university was helping them in their future, not just meeting their immediate needs at a superficial level. We also chose to remove “Shared Emotional Connection” and to keep “Rational Connection” (4-item subscale). “Rational Connection” was designed to measure whether the participant wanted the same things out of their experience in a certain community (e.g., “The people at Elmhurst University work together to solve problems that face the community”). Although a shared emotional connection seems stronger, third places are not necessarily designed to foster long-term friendships. A third place is meant to create consistent interactions with others (Granovetter, 1973). “Membership” (3-item subscale) and “Influence” (2-item subscale) were kept the same.
The final scale was the Inclusion of Other in Self (IOS) question. It was a 1-item scale where each option shows two circles intersecting to varying degrees (Aron et al., 1991). One circle was supposed to represent the “Self” (the participant), while the other circle is “Elmhurst University”, which should ultimately measure how much individuals make the community a part of their self-concept (see Figure 4).
After participants completed the belongingness measures, they were asked to pick up to 3 third places on the Elmhurst University campus. There were 16 options listed with an additional option for open response (see Figure 5). The participant is then asked to categorize the third places they have chosen using two scales we created. The first was the Oldenburg scale. We designed this scale based on Ray Oldenburg’s (1999) defining characteristics of a third place. It was an 8-item Likert scale, which was then averaged to give us the average score for each third place. We designed the following scale based on Dana E. Vaux’s (2015) definition of an accessible and accommodating third place. According to Vaux, a third place should be designed with a central location, an accessible path, an indistinguishable transition to enter, seating with subtle subdivisions, food availability, adequate lighting, and incorporation of technology (Vaux, 2015, as cited in Mclane & Kozinets, 2019). Based on these criteria, we created a 7-item Likert scale for participants to rate the accessibility of each third place they chose.
Participants were then asked to pick any obstacles that might have inhibited them from being involved on campus (e.g. academic obligations, work obligations, family obligations, etc.), and given an option to provide comments. Finally, in the debrief portion of the study, participants were informed that the study was aiming to see if there was a relationship between belongingness to the university and their demographic characteristics, as well as identifying the most frequented third places on campus.
Results
Table 1 Bivariate Correlations among Belongingness Measures
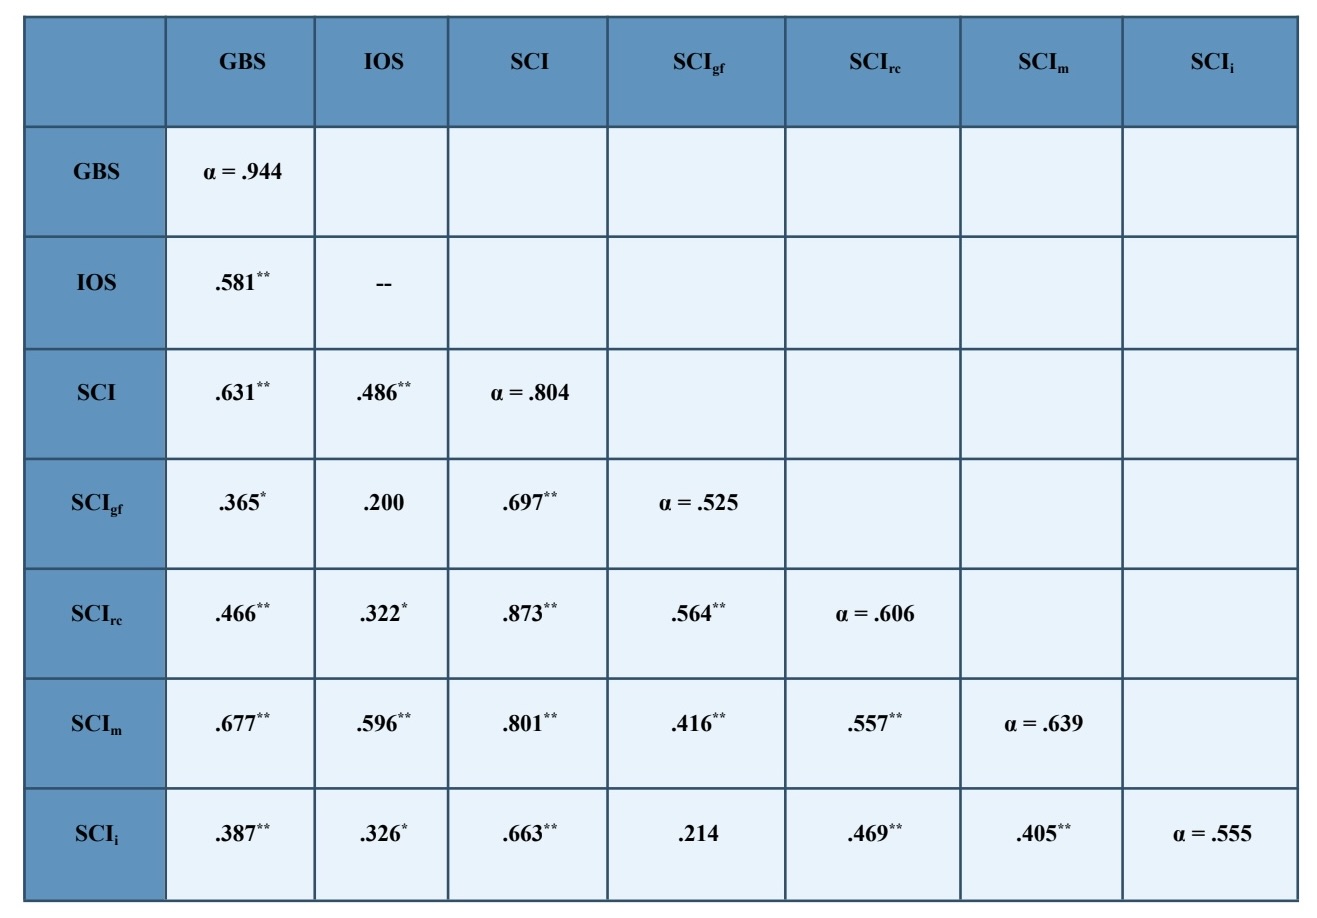
The data collected was used to determine the internal reliability of each belongingness measure, as well as their correlation to each other. The internal reliability of each scale was determined using Cronbach’s alpha. The General Belongingness Scale, the Sense of Community Index, and the Sense of Community Index subscale for Membership all had high internal reliability (GBS α = 0.97; SCI α = 0.868; SCIm α = 0.722). The other SCI subscales (Goals Fulfillment, Rational Connection, and Influence) had low internal reliability (SCIgf α = 0.678; SCIrc α = 0.636; SCIi α = 0.435), potentially due to the low number of questions within each subscale. Fortunately, when analyzing the correlation among belongingness measures, each scale was found to significantly correlate. This provided further clarification that our measures were accurately measuring a sense of belonging to Elmhurst University.
Hypothesis 1
Table 2 Belongingness Scores for Four-Year and Transfer Students
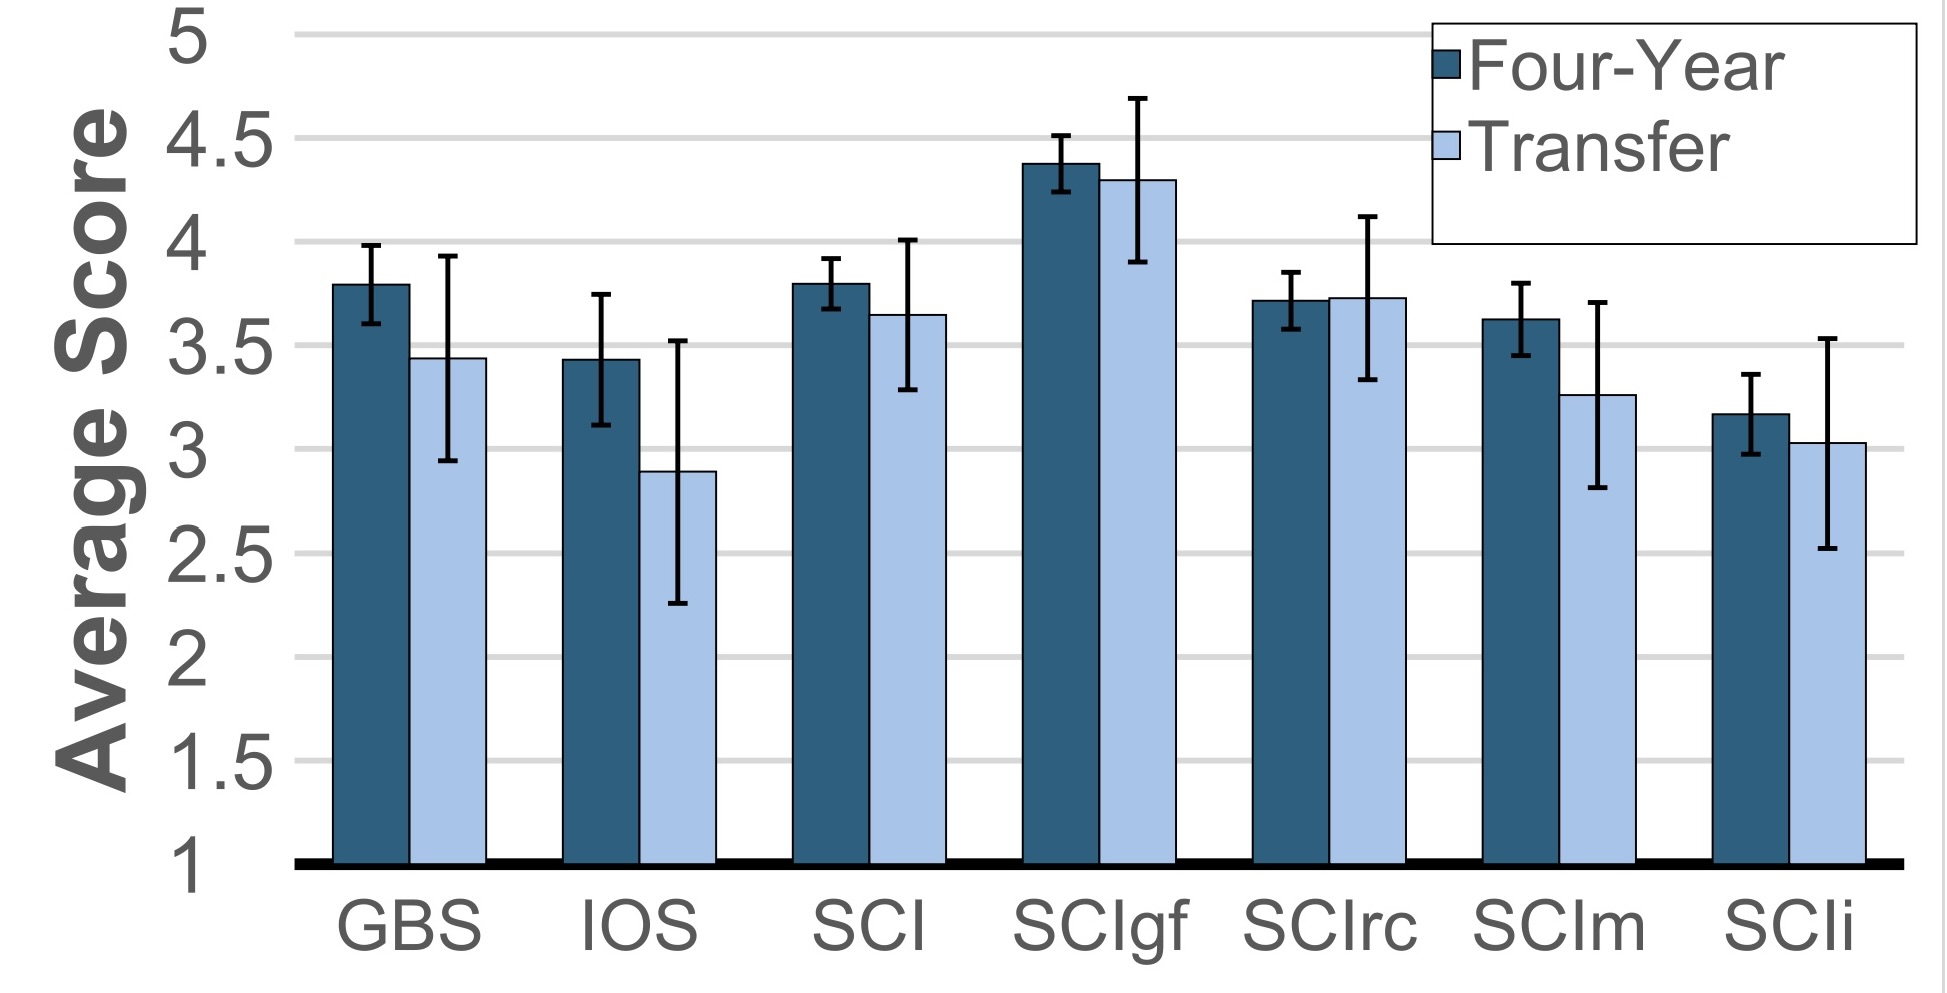
The first analysis was between transfer students and traditional four-year students. There were 22 transfer students and 94 four-year students. All scales were out of 5, so the graph represents the average scoring. When analyzing their average scores on the belongingness measures, there was no significant difference.
Table 3 Belongingness Scores for Residential and Commuter Students

The following scale shows the average scores between residential and commuter students. There were 75 commuter students and 41 residential students. There was a significant difference found in the General Belongingness Scale (marked with *), in which the residential students scored higher (M = 4.09; SD = 0.86) than the commuter students (M = 3.53; SD = 1.00). This could be since residential students are on campus for more time, which could result in a higher sense of belonging to the university.
Hypothesis 2
Table 4 Belongingness Scores for Non-Hispanic/Latino and Hispanic/Latino Students
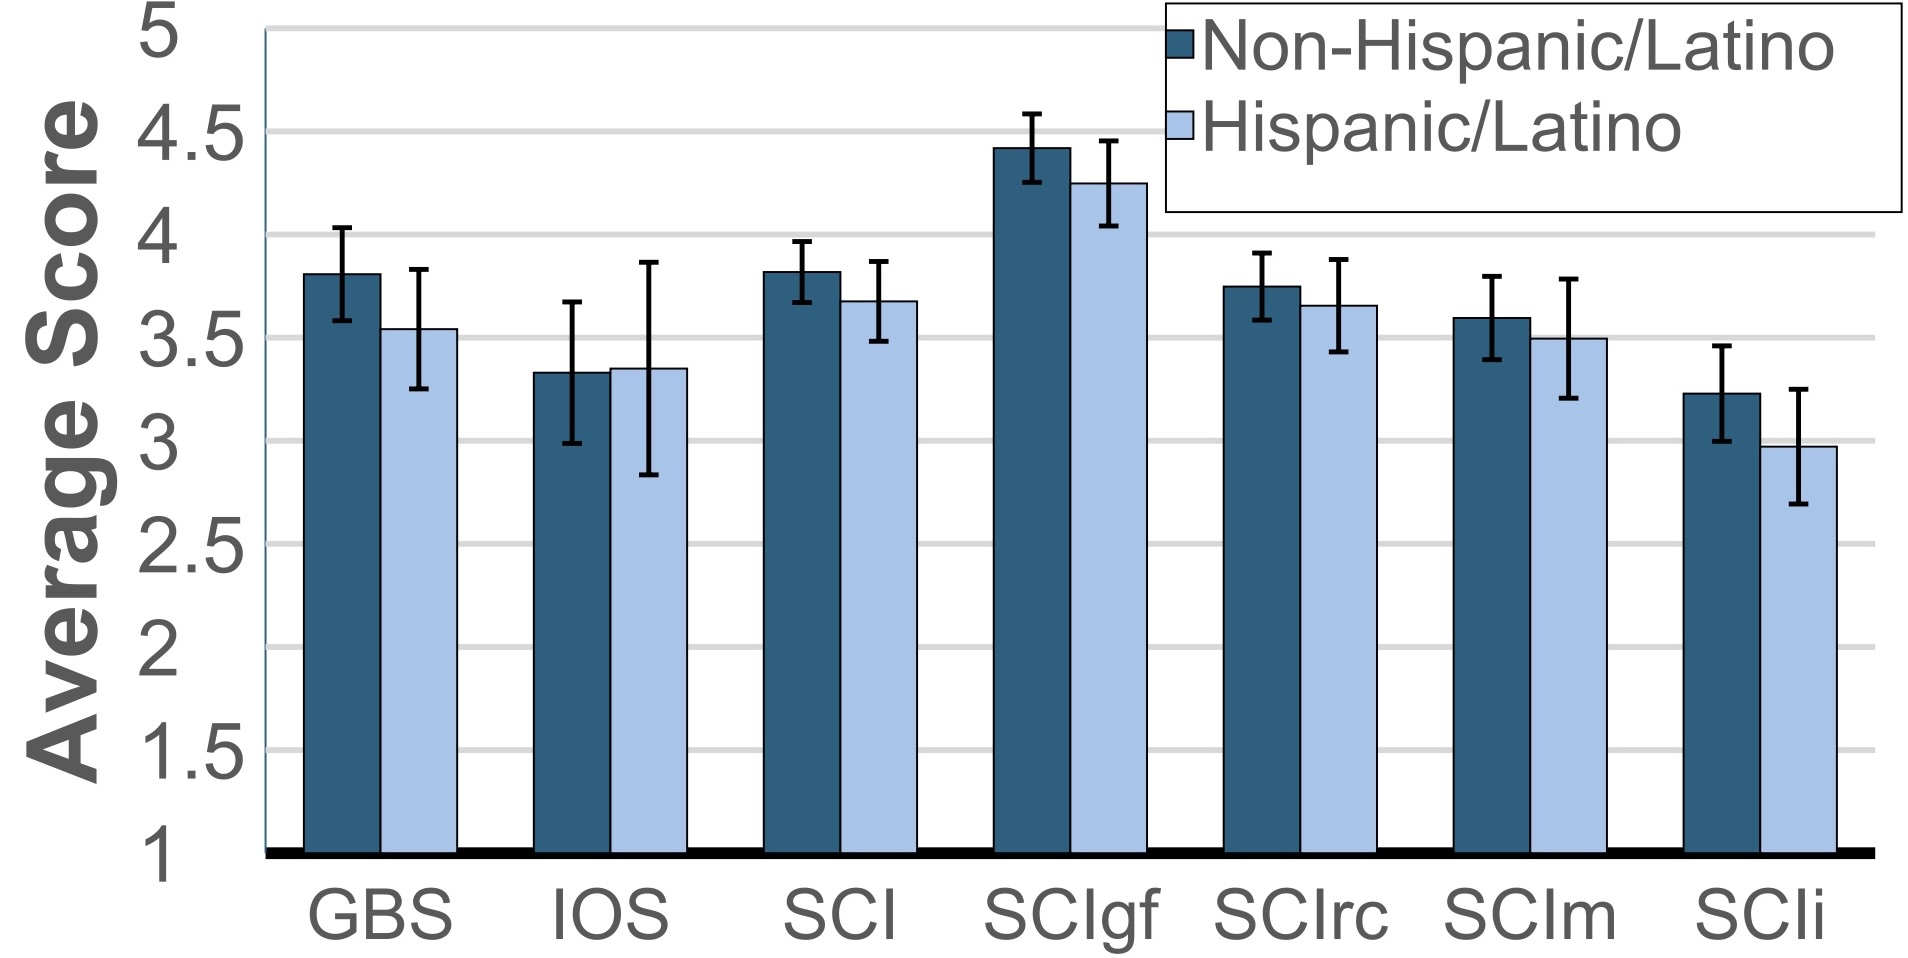
When looking at Hispanic/Latino students versus non-Hispanic/Latino students,
there were 36 Hispanic/Latino students and 80 non-Hispanic/Latino. There was no
significant difference in scores. This is a positive sign, because it reflects that Hispanic
and non-Hispanic students feel a similar level of belonging and connection to the
university. Since the percentage of Hispanic/Latino students enrolling at the institution is
increasing, this demographic remains relatively new and should continue to be studied.
Table 5 Belongingness Scores for Non-LGBTQ+ and LGBTQ+ Students
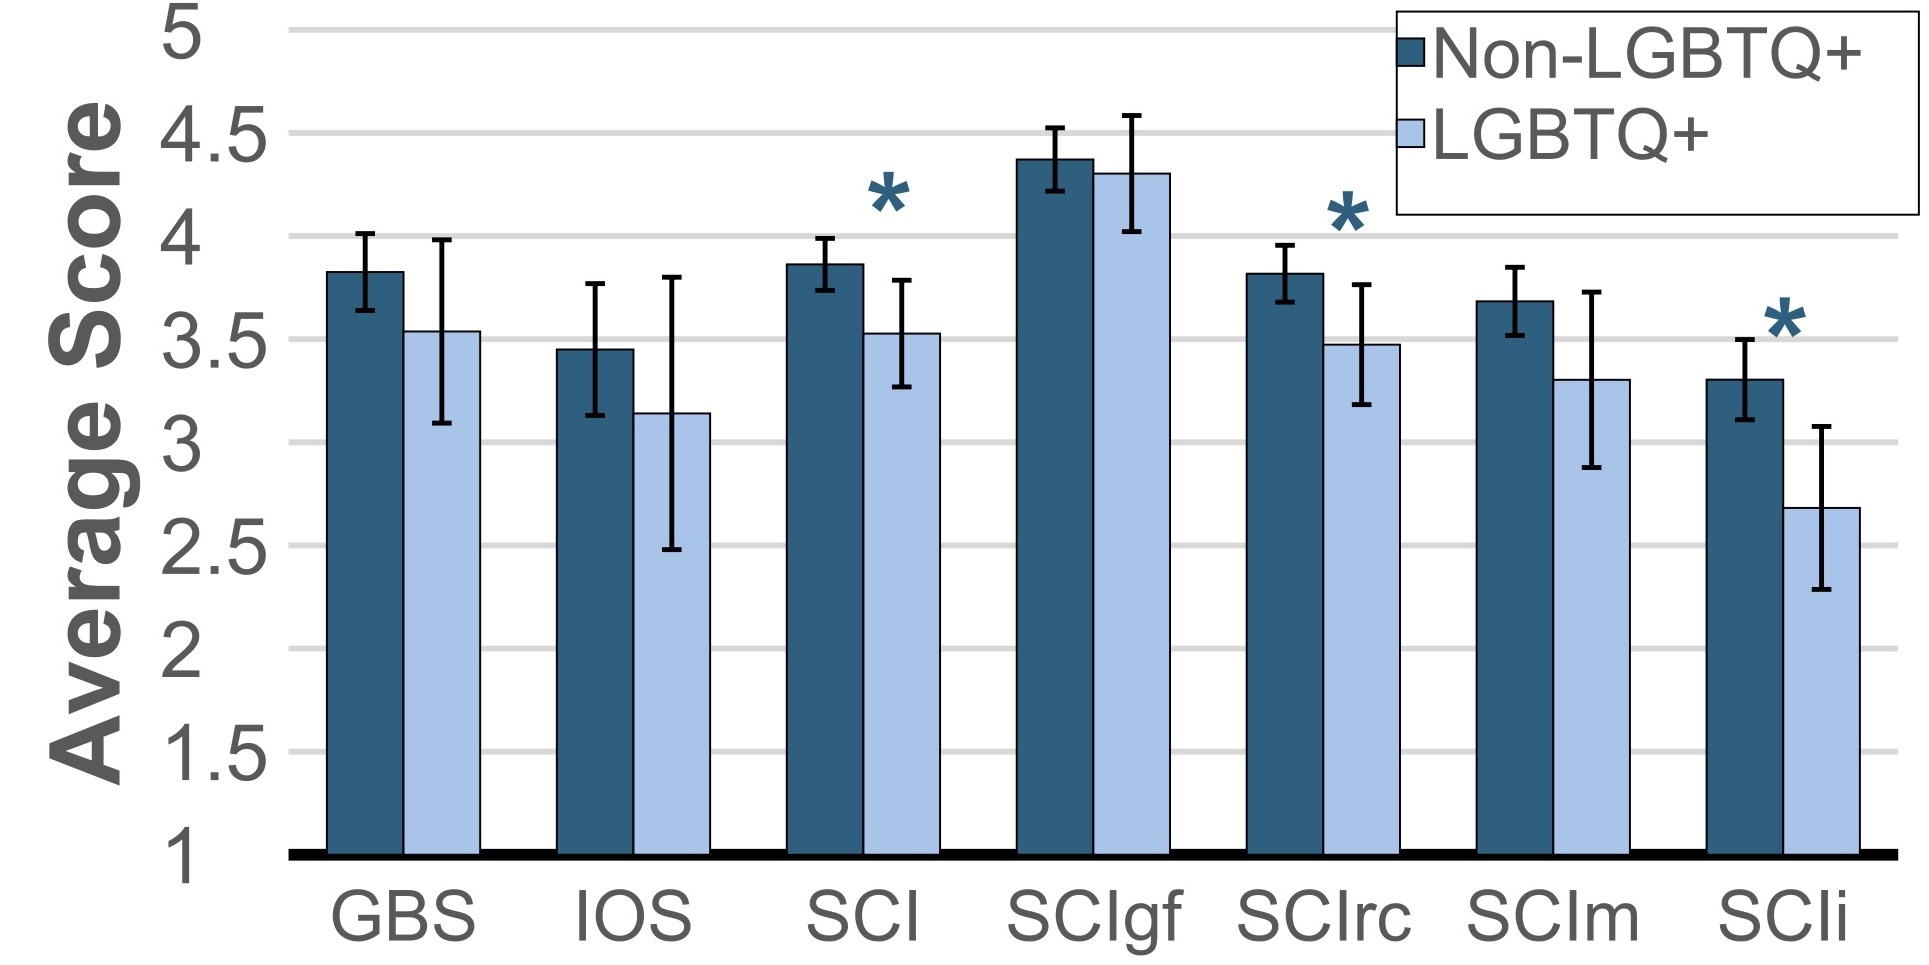
There was a significant difference when analyzing the belongingness measures between the institution’s LGBTQ students and non-LGBTQ students (marked with *). LGBTQ students scored significantly lower in the SCI (M = 3.53; SD = 0.62) and its subscales, Rational Connection (M = 3.47; SD = 0.70) and Influence (M = 2.68; SD = 0.95). Non-LGBTQ students scored higher in the SCI (M = 3.86; SD = 0.57) and its subscales, Rational Connection (M = 3.82; SD = 0.53) and Influence (M = 3.30; SD = 0.88). It is possible that LGBTQ students do not view the community of Elmhurst University as somewhere they can belong as much as non-LGBTQ students do. Since the scores were significantly different in Rational Connection and Influence, it would be beneficial to continue asking LGBTQ students if they feel a disconnect from other students and if they do not feel like their voice can create change at the institution.
Exploratory Analysis
Participants also provided data regarding the most frequented third places on campus. The most popular third place was the A.C. Buehler Library (n = 69), followed by the Founders Lounge (n = 51), and the Roost (n = 35). All three places met a lot of the characteristics on the Oldenburg (1999) Third Place Characteristics scale and the Vaux (2015) Accessibility scale. For example, all three places had food either available for purchase or frequently given out. They also had clear entrances, open seating with subtle subdivisions, and areas to play games/activities or to de-stress. These places were not necessarily centered around academics; therefore, they could provide a space for students to socialize and display their personalities without fear of judgment.
Table 6 Time Spent at A.C. Buehler Library

The A.C. Buehler Library had the highest average score on the Vaux (2019) Accessibility scale (M = 4.20; SD = 0.52). Most students who chose the library explained that they went there to do homework or to study. When asked how much time students spent there, the most popular amount of time was between 3-5 hours per week.
Table 7 Time Spent at Founders Lounge
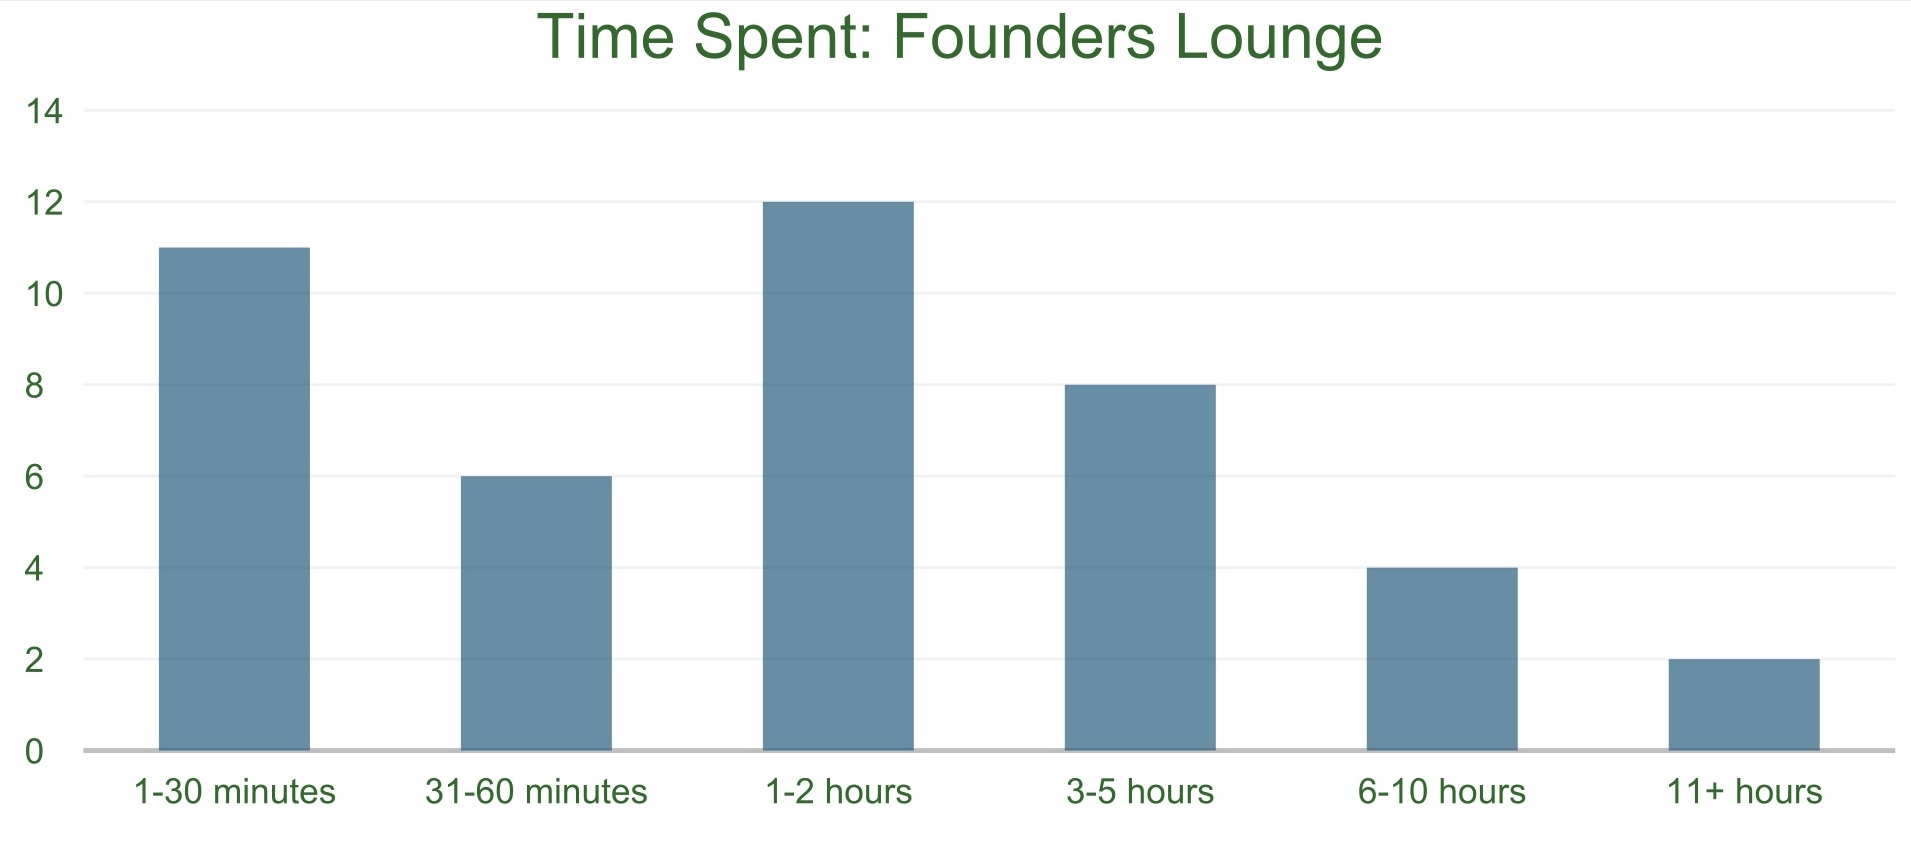
Founders Lounge had a normal average on both the Vaux (2019) Accessibility scale (M = 3.99; SD = 0.59) and the Oldenburg (1999) Third Place Characteristics scale (M = 3.88; SD = 0.59). Most students who chose Founders Lounge expressed that they used this space for studying or for hosting varying club/organization events. This is significant, since Founders Lounge acts as Elmhurst University’s Student Union. It is a multi-purpose space, which is likely why many students indicated that they would only spend 0-2 hours there per week. When clubs host events in Founders Lounge, its duration is typically an hour. Though the clubs/organizations are not considered third places, they do help form place attachment, which plays a key role in a student’s sense of belonging (Mclane & Kozinets, 2019).
Table 8 Time Spent at The Roost

The Roost is in the basement of the Student Union on campus. The Roost had the highest average on the Oldenburg (1999) Third Place Characteristics scale (M = 3.97; SD = 0.62) and a high average on the Vaux (2015) Accessibility scale (M = 3.97; SD = 0.63). Most students indicated spending their time at the Roost eating, playing games, talking, or hanging out with their friends. The Roost has a game room, with activities like pool, air hockey, foosball, ping pong, board games, karaoke, and video games. The range in activities might help form an environment that focuses on socialization rather than academic activities. The most common amount of time spent per week at the Roost was between 1-60 minutes, indicating that people don’t seem to stay for long despite it being a place that is meant to promote socialization.
Table 9 Third Places Ranked from Most Popular to Least Popular
The chart above shows how many participants picked each third place. The least frequented places seemed to be places that hold a specific purpose. The Commuter Lounge is a small section of a few tables meant for commuters to eat lunch and do homework, El Centro is a lounge area dedicated to Hispanic/Latino students on campus with a few tables and a television, the Office of Student Involvement is typically used for event planning, the Gaming Lounge is meant for students to play video games, the Dance Studio is typically for dance classes or dance clubs, and Faganal Hall is meant for the university’s indoor sports. It is possible that if a third place is more ambiguous, it is more popular because it can serve a variety of purposes. The least frequented third places also shared another commonality: size. Most of these places can only fit about 15 people comfortably at a time. Students may pass these places with the preconceived notion that the place would be full if they stopped by.
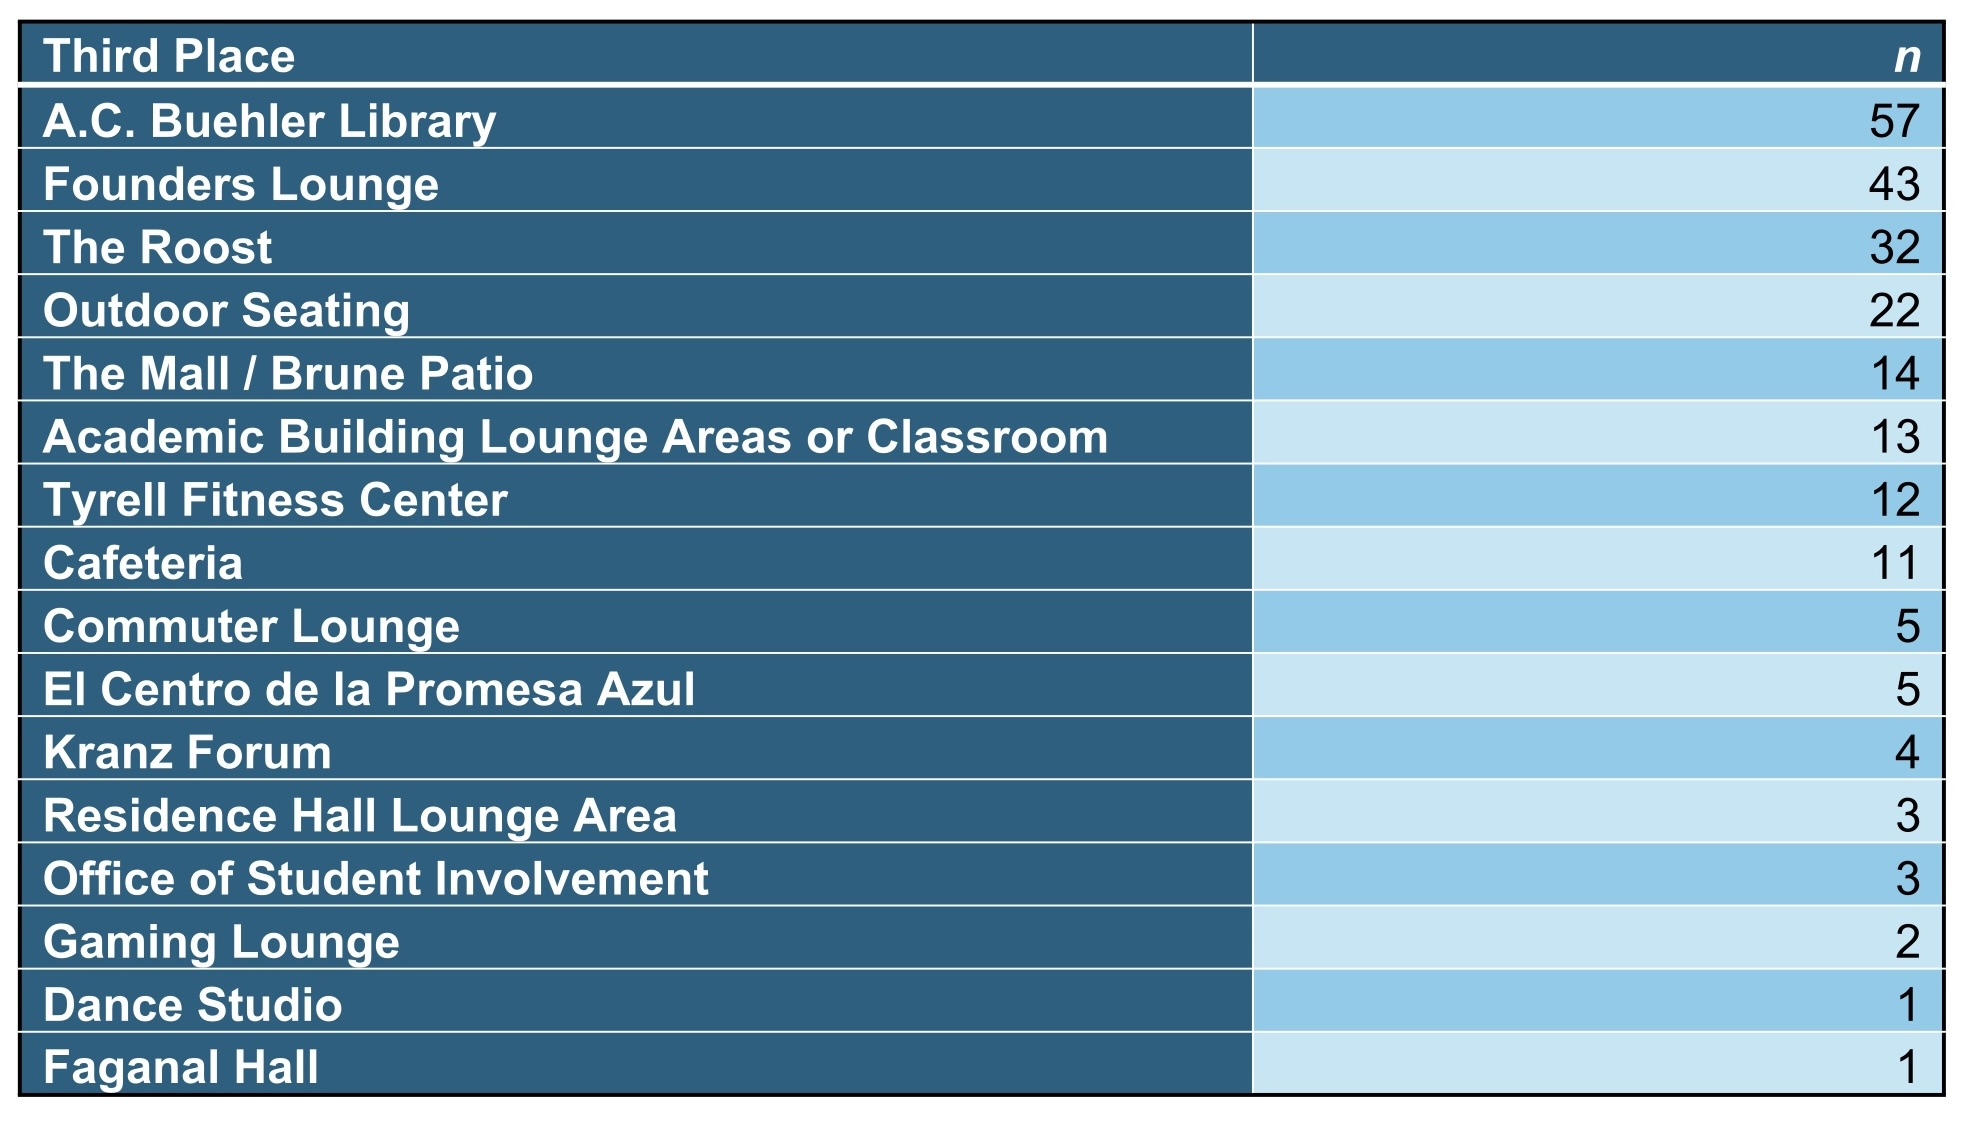
Table 10 Third Places Ranked from Most Popular to Least Popular Based on Participant Type

The table above demonstrates which third places were the most popular based on participant type. The highlighted boxes represent the highest amount of third places chosen, and the dark blue highlight represents the third place that was chosen the most within each participant type. Most groups chose the A.C. Buehler Library, but there were some outliers. Residential students chose Founders Lounge (n = 20) more than the A.C. Buehler Library (n = 12). LGBTQ+ students tied in both A.C. Buehler Library and Founders Lounge (n = 14). Students who preferred not to describe their sexual orientation chose the Academic Building Lounge Areas more than any other option (n = 3). We chose to highlight the top 4 third places, since many participants frequently chose Outdoor Seating, which seemed significant to highlight. This survey was sent out in March and April, which were relatively cold months. Even so, students were more willing to choose Outdoor Seating as an option. This could mean that students have a need for more natural light that outdoor seating provides.
Table 11 Obstacles for Involvement on Campus

The survey also asked participants if there were any obstacles that got in the way for involvement on campus. The most common obstacles were Work Obligations (n = 49), Family Obligations (n = 38), and Lack of Information about Events (n = 29). The first two obstacles were things that the university had little control over; however, the third option was significant because it demonstrated a lack of communication between the institution and its students. Participants were also given the option to fill in their own obstacles. Two participants expressed that they did not feel welcome, or that they had to know other people to go to these places. This is supported by previous research, since having familiar faces is a necessary characteristic for third places (Oldenburg, 1999). Another participant commented that there was a lack of wheelchair access, because the location was inaccessible, or the places were too crowded.
Discussion
The purpose of this study can be summarized by a comment made by a participant, “Being involved on campus is so important, so every student can have that college experience and grow as a person.” An institution should value personal growth, and they should provide places that foster individual growth, as well as social growth. Belongingness contributes to success, which is why it should be valued alongside academic achievement. Having places that allow students to interact with others can play a key role in whether a student feels like they belong to the university.
Third places at our institution may be too small. The top choices for third places were larger spaces that could accommodate more students. Options like El Centro and the Commuter Lounge have specific purposes and are catered to specific demographics, which might create a level of exclusiveness that drives people away from utilizing these places. The fact that some third places are too small could also be why so many participants felt more inclined to favor Outdoor Seating, even in colder months when the weather is not agreeable. It could be beneficial for the university to include warm enclosures outside, so that students can still appreciate the natural lighting and the sense of an open space.
It is also possible that their physical size might deter students from visiting third places. Granovetter (1973) stressed the importance of “weak ties,” which meant that people who went to different places would find pleasure in recognizing people, but not from forming friendships. There is a level of anonymity within weak ties, which is also present in the concept of a “regular” in a third place (Oldenburg, 1999). It is possible that the physical size of these third places does not allow for this level of anonymity. If regulars are coming into a place that only seats around 15 people, it is possible that there is now a level of “rank” beyond just a “regular.” This could mean that the place no longer serves as “neutral ground,” since one would feel an obligation or entanglement with the people that frequent the space.
Third places serve as a place for communal activity. There should be spaces for people to socialize or eat together if they choose to do so. The top third places offered food giveaways, or food available for purchase. It is a common saying when planning events that “food brings people,” which is necessary when trying to form an attachment for a third place. Accessible food should be prioritized in the creation or the improvement of a third place.
A limitation in our study was that we did not measure a correlation between time spent in a third place and one’s sense of belonging. This correlation could have served as further reasoning supporting the importance of student spaces that are not just used for academic work. Additionally, when collecting responses, we were unable to send a campus-wide communication via email. By only displaying flyers in each building and with each organization’s president, we were not able to oversee who received the flyers. Furthermore, when analyzing participant responses, it was realized the university’s Veteran’s Lounge was not included, which could have excluded potential data. Another demographic we could have studied was the number of international students on campus. Both veterans and international students know very few people once they arrive at a university, so making sure they feel like they belong may play a large role in whether they stay at the university or even in the country — in the case of international students.
Students receive presentations during their first-year seminar course (FYS 100) regarding all the different places available on campus with resources. Simply attributing these places to their resources is doing the locations a disservice. Students need to understand that these places are also made for them to connect with a diverse group of people. Furthermore, students who transfer to Elmhurst University are not able to take FYS 100, which makes them lose the opportunity to hear about these places in a centralized format. It may be beneficial for students to receive a standardized flyer, or some reminder at the beginning of every academic year to present all the third places available to students on campus.
Future research could involve looking into methods for advertising third places at Elmhurst University. An option would be to develop a lesson to present in classes explaining what a third place is, where they are on campus, what purpose they serve, and where to find them. Afterwards, data can be collected to see if that lesson had an impact on their willingness to visit these third places.
Universities value student retention and ensuring that all students want to continue their education until they walk the stage with their diploma. Creating a strong sense of belonging to the university plays a key role in lowering student attrition, which is why universities should reach out to marginalized students, as well as students who are naturally not on campus as much. In an earlier study about Elmhurst University, students were asked how much time they spent in different places on campus. When asked about their car, 59% of commuters reported spending around 1 hour per week sitting in their car, compared to 29.8% of residents (Majka & Nisivaco, 2019). Any percentage above 0% is worth addressing, because all students should feel comfortable enough to sit somewhere on campus besides their car. That is why third places should be further advertised to help students feel more comfortable staying on campus. Libraries are always the most popular third places, even outside of a college campus. Libraries highlight the idea that places to socialize without spending money do exist. The financial component should not deter people from finding community in a world filled with the cyclical, often monotonous, day-to-day routine.
Appendix 1
Figure 1
Flyer Sent to Collect Responses

Figure 2
Modified Sense of Community Index (Cope et al., 2020)
Instructions: Please indicate the extent to which you agree or disagree with each
statement regarding how you feel about Elmhurst University.
Strongly Disagree Somewhat Disagree Neutral Somewhat Agree Strongly Agree
1. I think Elmhurst University is a good place for me to achieve my academic and career aspirations. (GF)
2. People at Elmhurst University do not share the same values. (RC)
3. My classmates and I want the same things from Elmhurst University. (RC)
4. I expect to graduate from Elmhurst University. (GF)
5. I feel at home at Elmhurst University. (M)
6. Faculty and staff at Elmhurst University help me achieve my goals. (GF)
7. The people at Elmhurst University work together to solve problems that face the community. (RC)
8. I have no influence over what Elmhurst University is like. (I)
9. When a problem exists at Elmhurst University, my opinion on it is valued. (I)
10. It is very important to me to be a student at Elmhurst University. (M)
11. People at Elmhurst University generally don’t get along with each other. (RC)
12. I expect to be involved with Elmhurst University for a long time, even after graduation. (M)
Note. GF = Goals Fulfillment; RC = Rational Connection; M = Membership; I = Influence
Figure 3
Adapted Version of General Belongingness Scale (Malone et al., 2011)
Instructions: Please indicate the extent to which you agree or disagree with each
statement about what Elmhurst University is like for you using the scales below.
Strongly Disagree Somewhat Disagree Neutral Somewhat Agree Strongly Agree
1. When I am with other people at Elmhurst University, I feel included.
2. I have close bonds with friends at Elmhurst University.
3. I feel like an outsider at Elmhurst University.
4. I feel as if people at Elmhurst University do not care about me.
5. I feel accepted by others at Elmhurst University.
6. Because I do not belong at Elmhurst University, I feel distant during major campus events (like
Homecoming, President’s Ball, etc.).
7. I feel isolated from the rest of the Elmhurst University community.
8. I have a sense of belonging at Elmhurst University.
9. When I am with other people at Elmhurst University, I feel like a stranger.
10. I have a place at the table with others at Elmhurst University
11. I feel connected with others at Elmhurst University.
12. Friends from Elmhurst University do not involve me in their plans.
Figure 4
Adapted Version of Inclusion of Other in Self Scale (Aron et al., 1991)
Instructions: Which picture best describes your relationship with Elmhurst University?
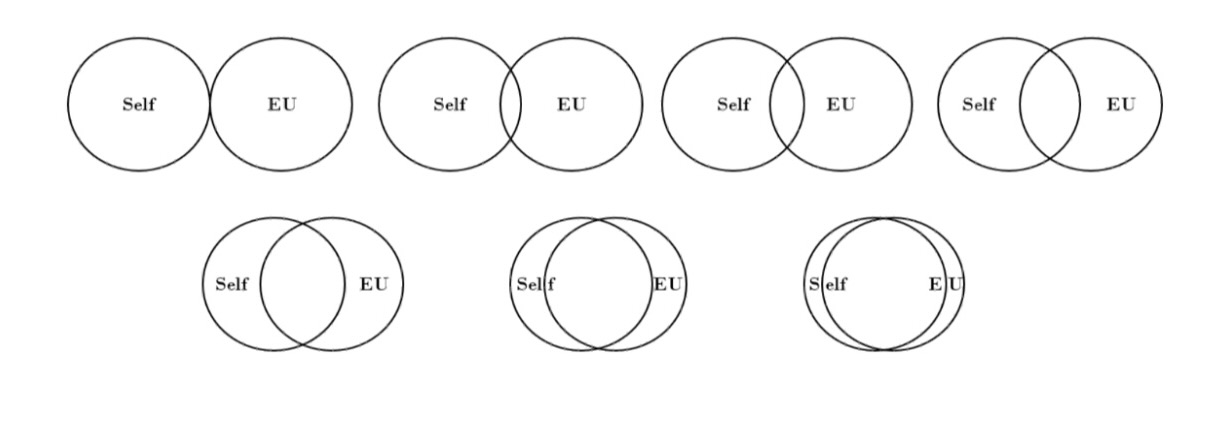
Figure 5
Third Places at Elmhurst University Survey Question
Instructions: With that definition in mind, which of the following third places do you most
enjoy going to when you aren’t in class, at practice/rehearsal, or at work? (Time spent in
a club or student activity do count.) Choose up to 3.
o A.C. Buehler Library
o Founder’s Lounge
o Frick Center Cafeteria
o The Roost
o The Commuter Lounge
o The Mall / Brune Patio
o Kranz Forum (“the ashtray” with Reinhold Niebuhr’s statue)
o Outdoor seating on campus
o Gaming Lounge in Daniels Hall
o Academic Buildings Not During Class (Lounge Areas or Classrooms)
o Tyrell Fitness Center
o Faganal Hall
o Residential Building Lounge Areas
o El Centro de la Promesa Azul
o Dance Studio in Faganal Hall (not for mandatory attendance)
o Office of Student Involvement
o Other location not mentioned: ___________
Figure 6
Oldenburg (1999) Third Place Characteristics Scale
Instructions: You have indicated that you enjoy going to X third place. Please answer
the following questions:
Strongly Disagree Somewhat Disagree Neutral Somewhat Agree Strongly Agree
1. To what extent would you agree that communication is the main activity in this third place?
2. To what extent would you agree that this third place provides neutral ground?
3. To what extent would you agree that this third place is a leveler with no ranking or status?
4. To what extent would you agree that this third place is accessible and accommodating?
5. To what extent would you agree that this third place has regulars who encourage attendance?
6. To what extent would you agree that this third place keeps a low profile (meaning homely and not
pretentious)?
7. To what extend would you agree that this third place allows for playful conversation?
8. To what extent would you agree that this third place can serve as a home away from home?
Figure 7
Vaux (2015) Accessibility Scale
Instructions: You have indicated that you enjoy going to X third place. Please answer
the following questions:
1 – Not at all 2 – Very little 3 – Somewhat 4 – Very 5 – A great deal
1. How accessible and central to activities is the location of this third place?
2. How accessible is the path into this third place?
3. How open is the path to this third place (i.e. how well does the path lead into this third place)?
4. How open is the seating in this third place (i.e. clear subdivisions vs. subtle subdivisions)?
5. How available is food in this third place (i.e. allowed, available for purchase)?
6. How adequate is the lighting in this third place (i.e. natural, electric)?
7. How much is technology integrated into this third place (i.e. Wi-Fi, computers provided)?